
Share something about Temperature, Energy, Heat. This could be a summary of what you remember about these terms, a picture, a meme, a haiku, a representation, a personal art project etc
For Thinkabout 3.1, you may create your PDF any way you want (e.g., write it out by hand or create it digitally). However, we highly encourage you to be able to draw, as we will be creating many graphical representations/diagrams and algebraic representations in this class. Most students write out their work on paper, take a picture, and convert it to a PDF. If you have a tablet with a stylus, you can also use that.
- Consider a domain or activity from outside of school at which you excel / shown improvement in. Write about how you handled difficulties and how you progressed to higher levels of expertise. Here are some additional prompts to answer:
- What did the process look like over time? Where did iteration/cycles occur?
- How did you feel at different points in time over the course of your journey?
- How did you know when you improved or moved to a higher level of expertise? Protip: if you are struggling to come up with a domain / activity at which you excel / have improvement in, ask a family member or friend to suggest one to you.
- Using your written out answers above, construct a model / representation / concept map of your journey towards becoming more expert-like. Be sure to include:
- How you handled difficulties / overcame obstacles or sticking points
- How you progressed to higher levels of expertise and recognized that you’d grown
- The feelings you had at different stages of the journey
- What are some personal resources that helped as you became more expert-like?
- A personal resource might be a(n) individual asset / attribute / characteristic that supports your growth. List 5-7+
Scientists don’t come up with “right answers.”
Usually, when your instructor asks you to “do problems” for homework or on a test, they expect you to get a “right answer,” right? Well, we don’t. As a matter of fact, for many of the problems you will encounter in this course, there won’t be one “right answer.” Science just doesn’t work that way. For every problem, there are a number of ways one can approach the problem, and each different solution path might result in different answers. But, that doesn’t mean that one of them is “right” and the others are not.
Scientists come up with arguments.
Much more important than an answer to a question or problem in science is usually the method by which one arrived at this answer. So, our emphasis is on the method you use to solve a problem – the pathway to your solution. We want to know what assumptions and decisions you’re making as you solve a problem, and how you’re using these assumptions and decisions to make an argument for your solution. That’s how science works! There is nobody who knows “the right answer.” But there are people who can look at what you’ve done and tell you whether the assumptions you’ve made are appropriate in a particular situation and if the argument you’ve constructed is valid and convincing. In science, this is called “peer-review” because the people who look at your work are other scientists.
So, if we don’t care so much about you “getting the right answer,” how will we evaluate your progress in this course?
Just like in a scientific publication, we ask you to be very specific about what you did and did not do, and how you arrived at a particular solution to a problem. We’ll practice this a lot, so that you know what we expect from you. This first problem is an extreme example of what problem-solving in this class looks like for you: We’ll actually give you some answers. A little further down, you’ll find a box with some answers that one might reasonably get when solving this problem. Note that we’re not saying these are the exact answers you will get or that we expect you to get! But your solutions to this problem might be quite similar to the ones given below.
Now, if we give you the answers, what do we want you to do?
We want you to describe in detail how you are using the diagram below to respond to the prompts in the problem. Write a story about the diagram and about how you are reading the graph to get the values you get. While this is stated a few times below, it’s worth repeating: We don’t want you to do any calculations for this problem! Instead, use the diagram and tell us how you’re using the diagram and why we should believe you that your answer to the problem is a reasonable one.
Yes, this might be a bit more work than what you’re used to from other classes. Later in this course, we’ll find shorter ways for you to show us your work and argument. But for now, please do write out a detailed story – including your assumptions, decisions, etc. – for each part of the problem.
On to the actual problem:
Use the particular Temperature vs. Energy-Added Diagram of the Three-Phase Model of Matter shown below to respond to the prompts in this Thinkabout.
Temperature vs Energy Diagram for H2O (1.0 kg)
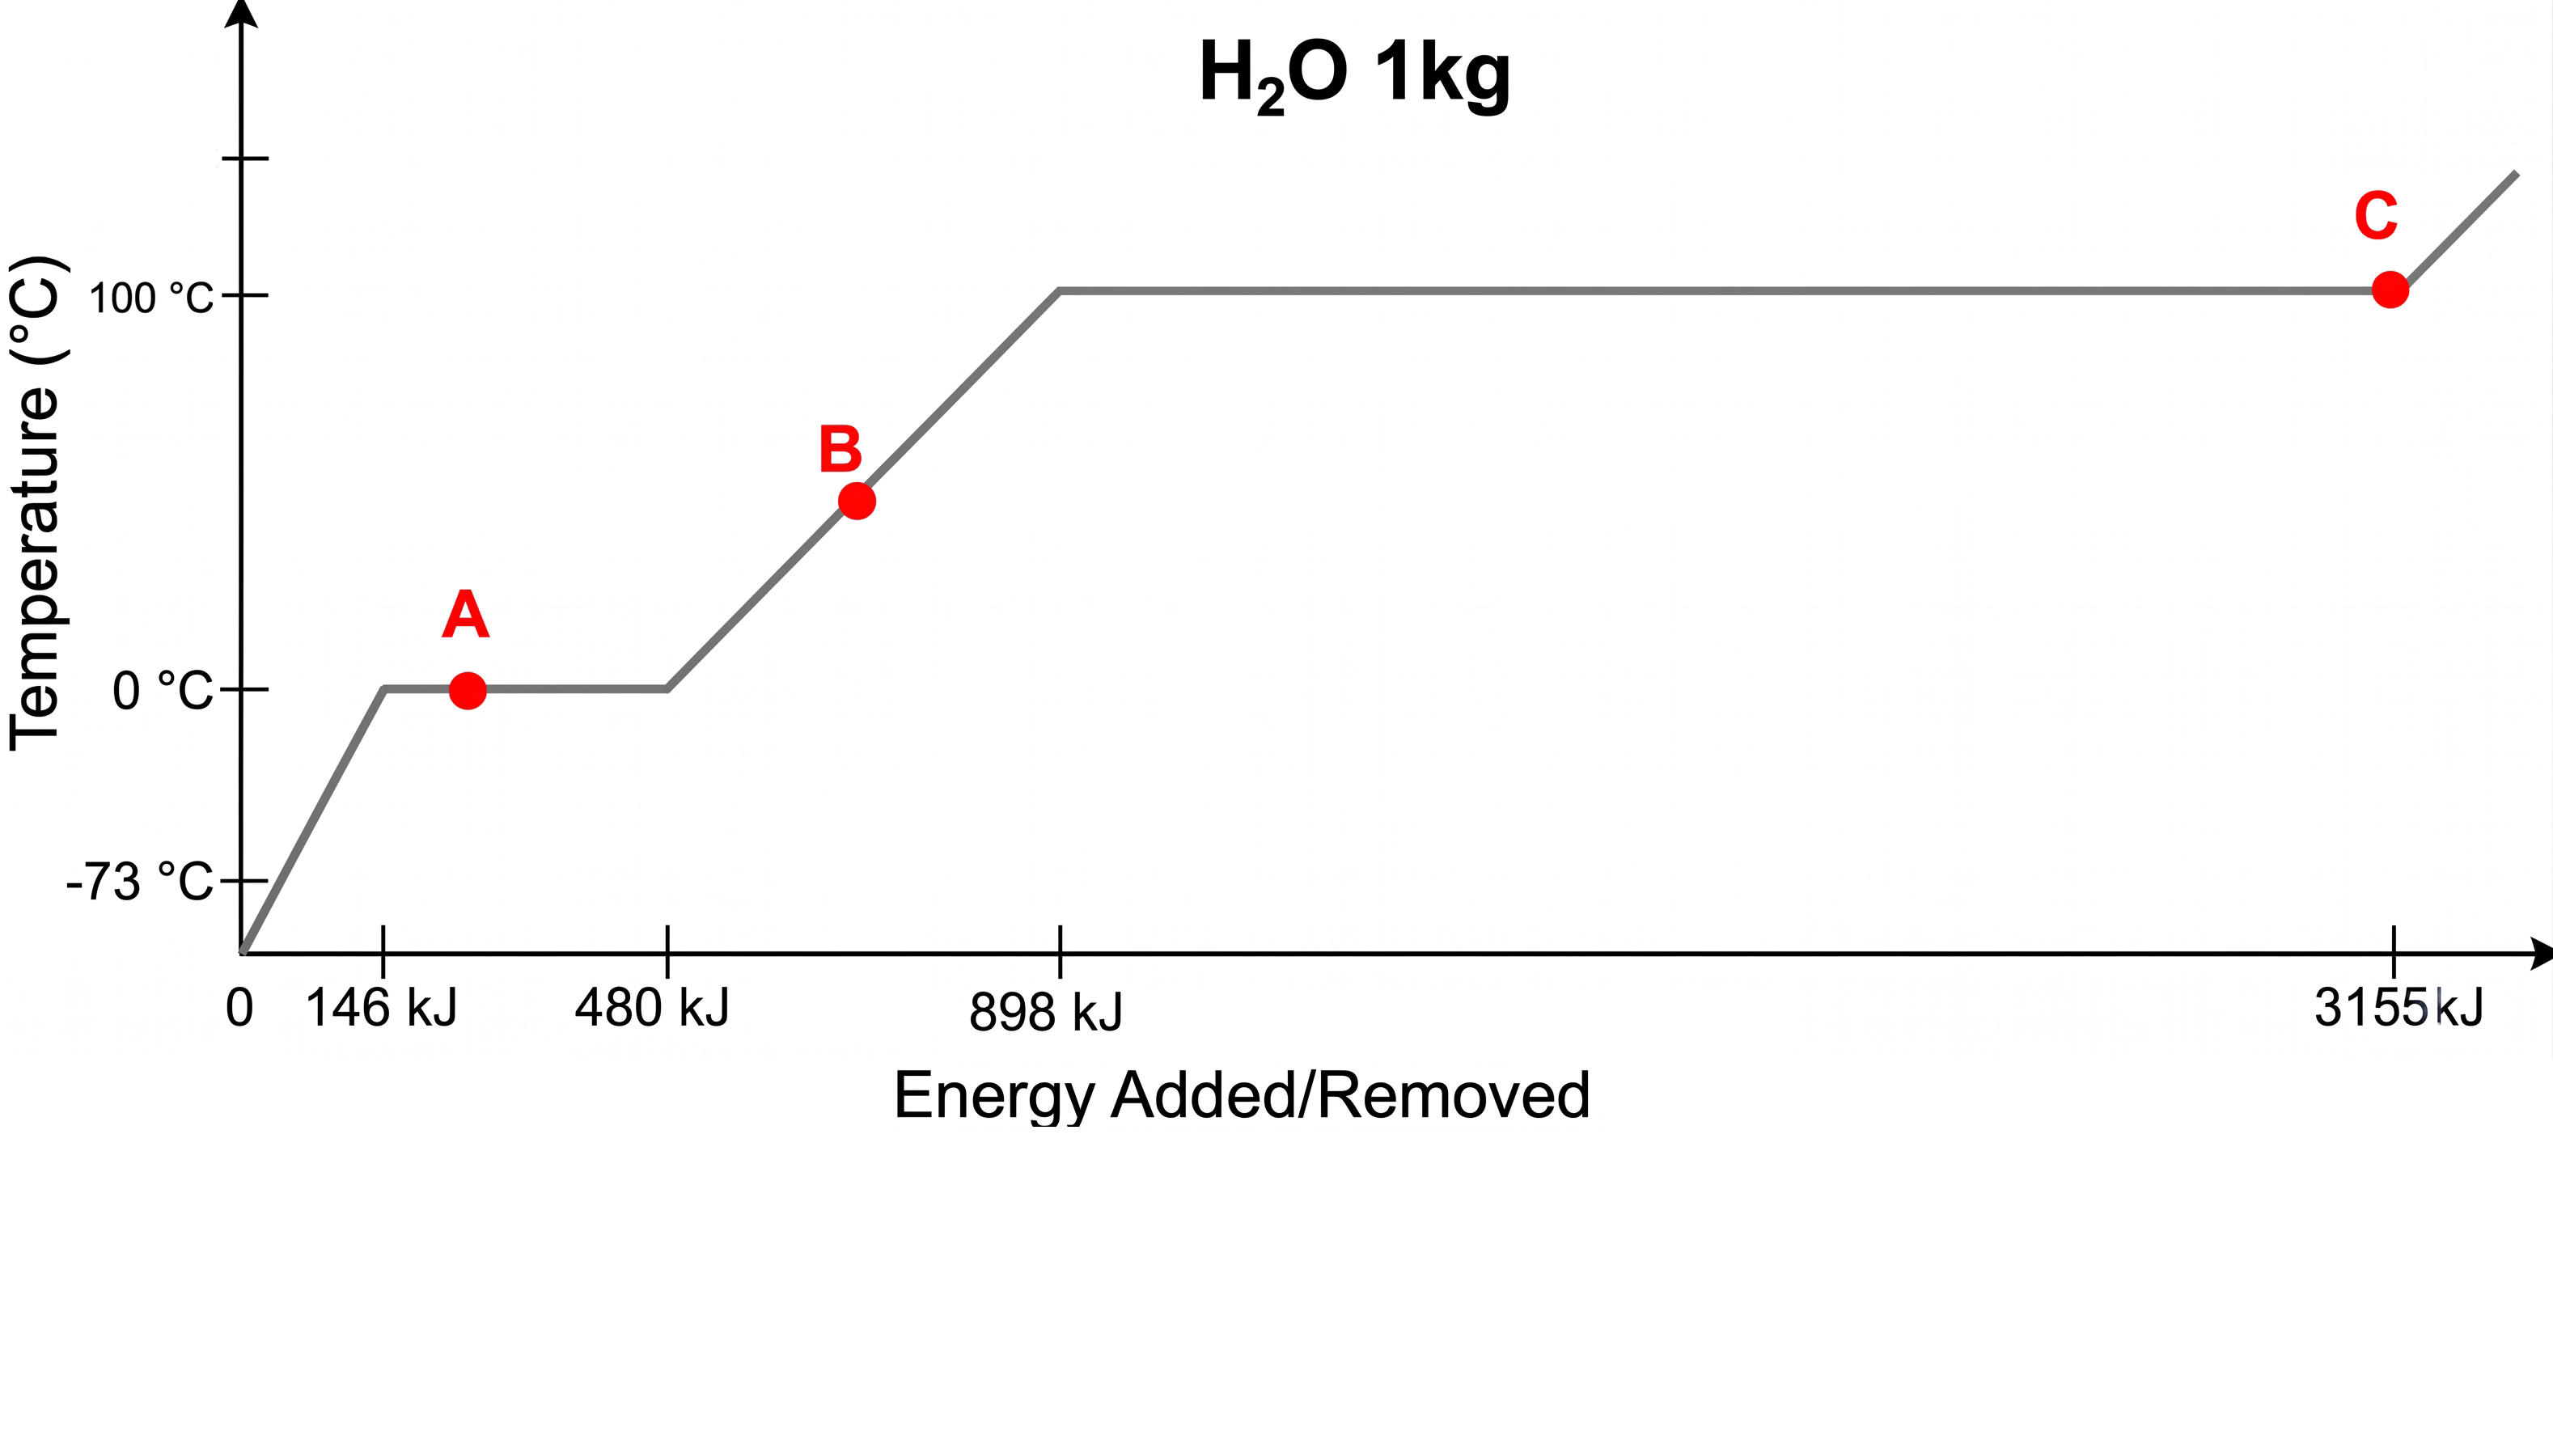
The values along the x-axis (146 kJ, 480 kJ, etc.) are the amounts of energy that must be added to get the 1.0 kg of water from an initial temperature of -73 °C to the next phase change. For example, 480 kJ is the total amount of energy that must be added to the water starting at the initial temperature of -73 °C to completely melt all the ice.
- Describe what is happening at each of the “corners” on the graph. Also, what phase is the water in at the letter A, B, C?
- Assume that you have one kilogram of water at an initial temperature of -73 °C. If 795 kJ of energy is added, describe the final state (approximate temperature and phase) of the water. If the water is in a mixed phase, determine very approximately the percent in each phase.
You are not expected to do any calculations at this time. Simply tell us what the diagram tells you (and how you know that it does).
- Repeat Part b but with 146 kJ of energy added to the water initially at -73 °C.
- Repeat Part b but with 1650 kJ of energy added to the water initially at -73 °C.
- State the initial and final conditions of the process that takes the system from Point C to Point B and determine very approximately how much energy would have to be added or removed.
- Repeat Part e for water initially in State A and ending in State C.
Again: Do not make any calculations to respond to these prompts!
Neatly write out all of the Energy-Interaction Diagrams, with the accompanying Tem-perature vs. Energy-Added Diagrams, listed below (these are the same scenarios that were requested in Activity ??).
Remember that complete Energy-Interaction Diagrams always include algebraic expres-sions of energy conservation. Refer to the Energy-Interaction Model discussion in the online resources.
- Cooling a piece of solid copper (Cu) from 500 °C to 350 °C.
- Warming a piece of ice from -20 °C to the melting point.
- Condensing steam completely to liquid at 100 °C.
- Completely sublimating a chunk of dry ice at -79 °C.
- Partially melting 25% of ice initially at 0 °C.
- Heating a piece of copper initially at 300 °C until it is half melted.
- Cooling and completely freezing H2O initially at 80 °C.
When using the Energy-Interaction Model to make sense of the behavior of a heat pack (or really, any thermal cycle), it helps to divide the overall process (cycle) into multiple sub-processes. Use the following sub-processes:
Initial conditions | Action | Final Conditions |
(a) liquid at 100 °C | taken out of boiler | liquid at 23 °C |
(b) liquid at 23 °C | triggered | solid/liquid at 54 °C |
(and insulated) | shortly after triggering | |
(c) solid/liquid at 54 °C | sitting on table | (in mixed state) solid at 23 °C |
(d) solid at 23 °C | placed in boiler | solid/liquid at 54 °C |
(e) solid/liquid at 54 °C | left in boiler | liquid at 100 °C |
Make four Temperature vs. Energy-Added Diagrams, one for each sub-process (a), (c), (d), and (e), but NOT (b). Also, make an Energy-Interaction Diagram for each process. Make sure you can describe each process in your own words using both of the representations.
We want to analyze triggering step (b) in Thinkabout 4.1 more closely using the Tem-perature vs. Energy-Added Diagram of the Three-Phase Model of Matter. This will help us get a deeper understanding of this part of the process and will enable us to extend the Three-Phase Model of Matter to make it explain actual phenomena more realistically. (It turns out that super cooling and super-heating are rather common. Usually, however, they occur over a very small temperature range and so go unnoticed.)
- Sketch a Temperature vs. Energy-Added Diagram for sodium acetate going from room temperature to approximately 100 °C, assuming the sodium acetate does not undergo any super-cooling, i.e., assuming that the heat pack is solid at room temperature, and changes phase at its normal phase change temperature, which you determined in Activity ??.
- On the same diagram, sketch the path representing the process of the liquid heat pack cooling down from 100 °C to room temperature with no phase change (now assuming there is supercooling). Check that the path you sketched makes sense by verifying that the changes in temperature and energy shown on the diagram as you move along the path you sketched match what you know about the actual changes in temperature and energy of the heat pack as it cools to room temperature without changing phase from liquid to solid.
Use the Energy-Interaction Model to explain whether the following statement is true or false.
“A quantity of ice at 0 °C must contain less total energy than the same quantity of water at 0 °C.”
According to the definition of heat (energy that crosses a system boundary), can an energy system contain a certain amount of heat? Explain.
Imagine that you place a piece of copper with an initial temperature of 20 °C in contact with an amount of liquid water with an initial temperature of 100 °C. Assume that the physical system consisting of the copper and the water is thermally isolated from everything else; i.e., water and copper can only exchange energy with each other.
- Using the Three-Phase Model of Matter as applied to each substance and your understanding of what “coming to thermal equilibrium” means:
- Sketch two Temperature vs. Energy-Added Diagrams – one for each substance – and indicate the initial state for each one.
- Explain in a sentence or two how you can tell if either substance will undergo a phase change during the process of coming to thermal equilibrium. You are expected to use what you already know regarding the thermal properties of copper and water, but you do not need to do any calculations.
- Construct a complete Energy-Interaction Diagram for the process that ends when the two substances are in thermal equilibrium. Don’t forget that a complete diagram always includes an algebraic expression of energy conservation.
- Now consider a similar process. Use the same initial conditions for the copper, but assume that the H2O is initially in the gas phase at 100 °C.
- Sketch two Temperature vs. Energy-Added Diagrams, one for each substance, and mark the initial state for each one.
- How can you determine if the H2O will undergo a temperature change? (What calculations and comparisons – think energy – would you need to make? Don’t actually do the calculations; just explain what you would need to do.)
Consider again the phenomenon of two substances at different temperatures exchanging energy as they come to thermal equilibrium: Substance A and Substance B, at initially different temperatures, are placed in contact. They are able to exchange energy via heating, and they can only exchange it with each other. Substance A has a greater initial temperature than Substance B. No phase changes occur during this process.
Use the Energy-Interaction Model to create a logical explanation that unequivocally shows that the following statement about the heat exchange described above for Substances A and B is true or that it is false:
“The energy that is transferred as heat to or from the object with the larger heat capacity must be greater than the energy that is transferred as heat to or from the object with the smaller heat capacity.”
Suppose you used a hot pot to convert a 150 g piece of ice that was initially at -15 °C into liquid water at 50 °C.
- Represent this process in two complete Energy-Interaction Diagrams, one covering the interval from -15 °C to 0 °C liquid, and the second covering the interval from 0 °C liquid to 50 °C.
- Now create a single Energy-Interaction Diagram for the entire process.
- If your hot pot has a power rating of 600 watts, show how to find how long it will take to complete the process.
Thinkabout 6.5 emphasized the significance of the beginning and end of the interval – we’ve called them “initial” and “final” states so far. This Thinkabout illustrates
- that the question you’re asking determines the interval being analyzed with the Energy-
Interaction Model; and
- that sometimes it’s necessary to adjust the size of the interval in order to be able to use the model.
The physical process we want to analyze with the Three-Phase Model of Matter and the Energy-Interaction Model is the following:
Imagine you are using your hot pot to gradually heat a 500 g block of ice that has just been removed from a freezer with an internal temperature of -25 °C. The hot pot is fairly well insulated, so it is reasonable to assume that all of the energy transferred into the pot from the electrical heater located in the bottom of the pot goes into the H2O. We can also assume that the heat capacity of the pot is much smaller than the heat capacity of 500 g of H2O (whether solid or liquid), so we can ignore the thermal energy system of the pot itself.
One question we could ask is, “What is the final state of the water (phase and tempera-ture) after the addition of 252 kJ of heat?”
- Explain why – based only on the given information and without further analysis or calculation – it is not possible to construct a single Energy-Interaction Diagram that could be used to determine the final state of the water.
[Hint: try to construct such a diagram. Another way to think about this is whether you can define the final state so that it depends on only one variable without making unjustified assumptions?]
- In cases like this, you must first use the model to analyze a shorter interval. Can you construct an Energy-Interaction Diagram that could be used to determine how much energy is needed to increase the temperature of the ice to 0 °C?
Now explain in a few sentences how to proceed using the Energy-Interaction Model
to find the final state of the H2O.
Perhaps you recall that when table salt, NaCl, is added to water, the freezing point of water is lowered. Consider a mixture of 2.5 kg of ice and 50 g of liquid water and a small, separate container of finely powdered salt. This mixture is contained in a fully insulated container that prevents all thermal interactions with the environment. Both the salt and the ice-water mixture are initially at the freezing point of water, 0 °C. The salt is then added to the ice-water mixture, and the system of ice-water and salt is allowed to come to thermal equilibrium. The final equilibrium temperature is less than 0 °C.
Use the Energy-Interaction Model to model the new ice-water-salt system and pre-dict if there will be a greater or lesser amount of ice in the final equilibrium state than in the initial state before the salt was added. Your explanation should include a complete Energy-Interaction Diagram.
[One way to model this system is with one thermal energy bubble for everything and one phase energy bubble, i.e., in terms of the model, it is not useful to distinguish between the various chemical components in order to answer this particular question.]
This Thinkabout is a thought experiment to make predictions about an actual ex-periment we will do in class, where you will get to observe the phenomenon described in Thinkabout 6.7.
Imagine you fill an insulated cup almost full with chopped or crushed ice, and measure the temperature after a minute or two, once it’s all come to thermal equilibrium. Since this ice is frozen water, the temperature should be at 0 °C or not more than a couple of degrees below. Then, imagine you add a bunch of salt and stir it around.
What do you think the lowest temperature you can attain will be? Why? What happens to the amount of liquid present if you keep stirring and adding salt? How can we understand this phenomenon in terms of thermal and phase energy systems?
Develop an explanation for the changes you would observe in this system (decrease in temperature and change of phase) in terms of the Energy-Interaction Model.
You are shopping for a new microwave and notice that the specifications report “Power” in units of “Watts.” This is a bit confusing as you know microwaves are used to “heat” food. In physics class, heat means a transfer of energy into or out of your system, and it has units of Joules.
Luckily, your friend tells you that “Power” is the rate at which energy is transferred. You decide to investigate the relationship between power and temperature change to help you decide how “powerful” of a microwave you want to buy.
Specifically, you are wondering what the temperature change of a cup of water will be when you heat it with your old microwave at home.

The Big Question is: How much does a cup of water increase in temperature when heated in a microwave for 45 seconds?
We’ll answer this Big Question in steps:
- Use the microwave’s power rating to determine how much energy the microwave uses when turned on for 45 seconds (you can read the power of the microwave off the mi-crowave information plate, see below). Then use the algebraic representation of power below to determine the amount Q of energy transferred.
- Assuming all the energy that the microwave draws from the power grid goes into the water, create a model that predicts the change in temperature of the water.
- Carry out the necessary calculations to get an answer to the Big Question.
Maybe useful information:
- 1 cup of water ≈ 250 mL = 0.250 kg of water
- 1 kJ = 1000 J and 1 kW = 1000 W
The definition of power in physics is the rate by which energy is transferred: P = Q , where P is power, Q is the amount of energy transferred as heat, and t is time in seconds. The units of Power are Watts = Joules .



This is a picture of the microwave information plate often found on the inner wall of your microwave.
A 2.2 kg block of ice (H2O) initially at a temperature of -20 °C is immersed in a very large amount of liquid nitrogen (N2) at a temperature of -196 °C. The N2 and H2O are allowed to come to thermal equilibrium. [T BP(N2) = -196 °C]
Create a particular model of this process and use it to determine how much liquid N2 is
converted to gas (vapor).
[Hint: The emphasis on “very large” implies that there will still be liquid N2 left when the two come to thermal equilibrium.]
The 2.2 kg block of ice from Thinkabout 7.1 is eventually removed from the liquid N2 (after reaching thermal equilibrium with the liquid N2) and placed in a very large amount of liquid H2O at 0 °C, where it comes to thermal equilibrium with the liquid H2O. Create a particular model of this process. How much of the total water is now ice?
Before we start with this problem, let’s review what the Energy-Interaction Model does for us. As we have said before, conservation of energy relates values of certain physical parameters at the beginning of a process to the values of those parameters at the end of the process. The parameters are typically the indicators of the energy systems that change during the process or interaction. If we have a question about – or want to predict values for – some parameter and this parameter happens to be an indicator of an energy system, or a coefficient in an expression for an energy system, then we can proceed to construct a particular model and see if it gets us what we want.
The Phenomenon: Three rocks of equal mass are thrown with identical speeds from the top of the same building. (1) Rock X is thrown vertically downward, (2) Rock Y is thrown vertically upward, and (3) Rock Z is thrown horizontally.
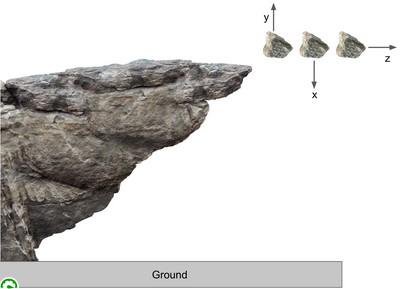
The Question: Which rock has the greatest speed just before it hits the ground? Assume air resistance is negligible.
How can we determine this? We could take a guess, but it helps our argument if it is possible to apply the Energy-Interaction Model. The prompts below will guide you through the process.
- Let’s start by making a prediction based on your prior experience. Don’t waste a lot of time on this right now, but it’s useful to give it some thought. We will definitely come back to this at the end in Part (f). Your first, intuitive ideas might be very useful!
- Does the question involve a parameter that you know to be an indicator of the change in an energy system? Which energy system and what is the indicator?
- Rock X: Construct an Energy-Interaction Diagram for Rock X, which is thrown straight down. Write out the expression for energy conservation, based on your Energy-Interaction Diagram, as ∆E’s; then substitute in algebraic representations for the different energy
systems. We are not asking to go any further, but if you “just have to,” go ahead and try solving it for the final speed, vf (but you really don’t need to).
- Rock Y: Now, without actually writing anything down, consider what would be different in your Energy-Interaction Diagram for Rock Y. How about the algebraic representation – anything different? Go back and re-read the “The Phenomena” description at the beginning of the Thinkabout, if you are not sure. Is there anything different in terms of what goes into the model? In terms of the Energy-Interaction Model are there any differences? Yes or No? Are you 100% sure? Why?
- Rock Z: Repeat for Rock Z. Any differences in the model? Yes or No?
- Do you believe that conservation of energy holds true for these three phenomena? An-other way to ask this: Does the particular energy model you developed apply to all three cases? If yes, what does conservation of energy tell you about the final speeds of the three rocks with 100% confidence?
- How do you reconcile your result in Part (f) with your initial ideas from Part (a) above? They are not crazy, because there are indeed very obvious differences in the three situa-tions. Why don’t these differences matter to energy conservation? Try to be as explicit here as you can be. This is what we will focus on in the Thinkabout follow-up in discussion-lab.
A person pulls a bucket of water up from a well using a rope. Assume that the initial and final speeds of the bucket are zero (vi = vf = 0), and that the person lifted the bucket a vertical distance h. By looking at energy changes in the bucket-Earth physical system, we can make sense of the force the person must exert to pull the bucket up and determine the amount of work the person does.
- Is the system open or closed? What energy systems undergo a change during this process? Construct an Energy-Interaction Diagram and include the algebraic expression of energy conservation (in terms of ∆E’s and, if open, any heat or work).
- Substitute the algebraic expression we use for the change in gravitational potential energy and solve algebraically for the work done by the person on the rope/bucket.
- Use the definition of work in terms of force and distance (refer to the Energy-Interaction Model Summary) to find the average force exerted by the person on the rope and bucket while they are lifting it up.
Thinkabout 10.3
Recall dropping a golf ball: The model used for the golf ball falling showed that we could ignore energy loss. Note, if we were to extend the model to include a bounce, the golf ball would return to its initial height but go no higher. We could also extend the model of the coffee filter falling. In this case, the initial energy of the coffee filter goes out of the system and cannot be used to bounce the coffee filter upward. In both cases the falling object never goes higher than the initial height. Now we need to figure out what is happening in a new phenomenon which may include a new type of energy.
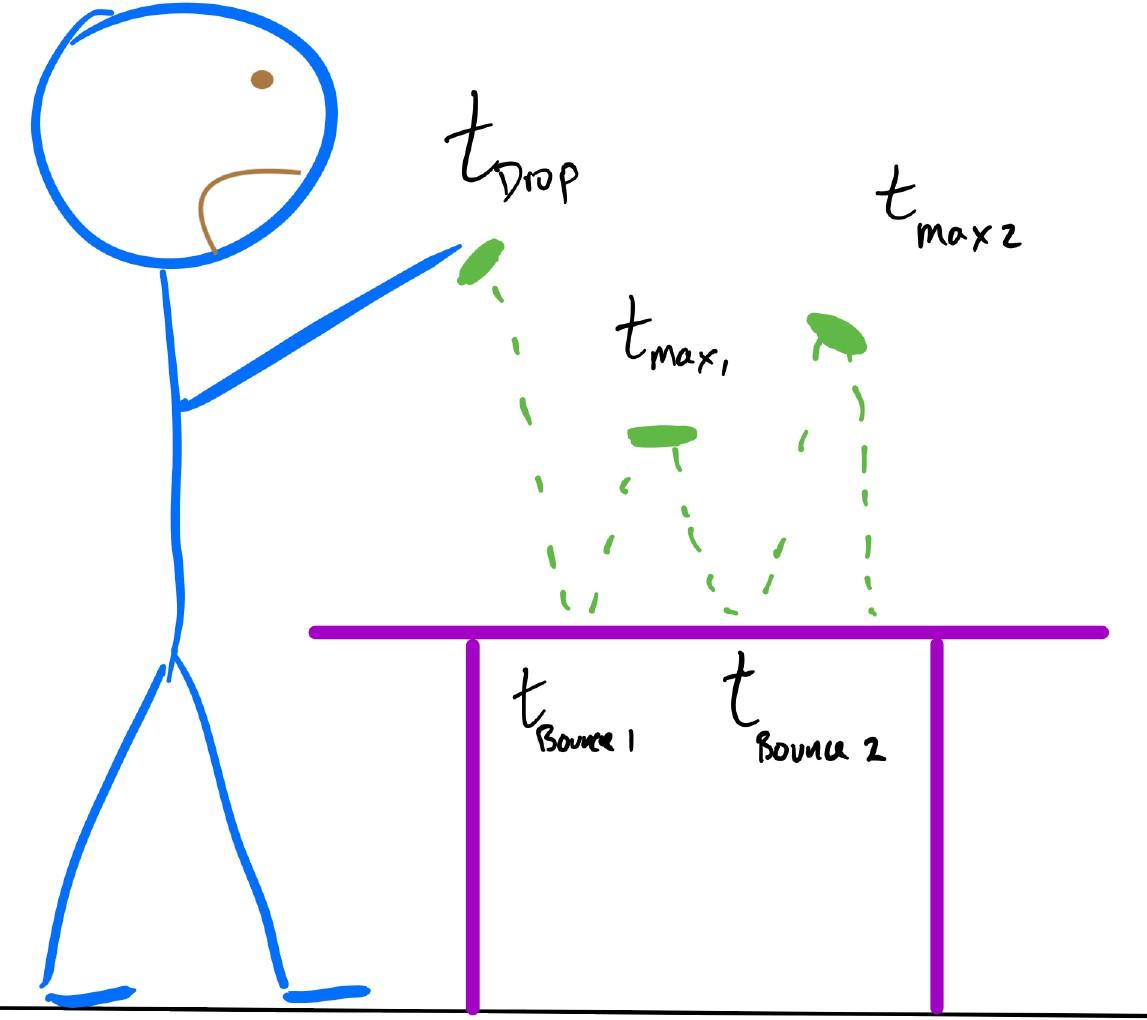
The Tic Tac Phenomenon: Christine takes a Tic Tac out of the container, but at time tDrop, she accidentally drops it onto the tabletop. At first, everything seems normal as the Tic Tac hits the table at time tBounce 1 and bounces a small distance upward. At time tMax 1, the Tic Tac has reached a maximum height, but it’s nowhere near to its initial height. The Tic Tac bounces again, at time tBounce 2. After Bounce 2, the Tic Tac moves upward to a second max height, which it reaches at time tMax 2. The Tic Tac still doesn’t reach its initial height, but Christine is shocked to see that the Tic Tac’s height at time tMax 2 is larger than the height the Tic Tac reached at time tMax1.
Write an argument: Explain why the Tic Tac’s height at time tMax 2 is larger than the height the Tic Tac reached at time tMax 1. HINT: think carefully about your interval(s) as is determined by the particular question you are answering. Your model sheet may be helpful in identifying important indicators and associated energies.
Remember, an argument consists of your response to the question in a complete sentence, followed by a “because statement” citing evidence. In this class, your evidence comes from the model you use to make sense of the phenomenon. Thus, a graphical representation of your model will be necessary to answer these questions. What diagram(s) have we been using in class lately? Be sure to include those!

We have modeled several physical systems using the Energy-Interaction Model: a
falling golf ball, a falling coffee filter, and a hanging spring-mass. Use what you have learned about mechanical energy to create a physical situation that matches the following transfers of mechanical energy.
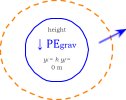
Do Steps 1-3 for the three Energy-Interaction Diagrams shown below:
- Define the system the Energy-Interaction Diagram describes.
- Tell a story about what happens to the system. Be sure to fully describe the initial and final states of the system at the beginning and end of the interval. Feel free to get creative! (No stories about golf balls, coffee filters) NOTE: These Energy-Interaction Diagrams are incomplete because they do not have time lines indicating Beginning and End – they were purposefully left off so that you could create your own story
- Draw a picture that shows what happens in your story.
Energy-Interaction Diagrams:
(a)
W
∆PEgrav = W
(b)
W
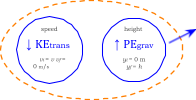
∆KEtrans + ∆PEgrav = W
W
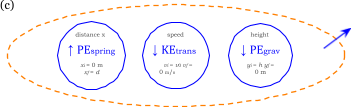
∆PEspring + ∆KEtrans + ∆PEgrav = W
The Phenomenon: Christine throws a ball straight up, letting go of the ball at a height of yi above the ground. When she lets go, the ball has an initial speed vi. The ball travels straight up to its maximum height ymax and falls back down. Assume the frictional effects from air resistance are insignificant.
Big Questions: If the initial upward speed of the ball described above is 10 m/s, and the ball is released at a height of 1.5 m above the floor, what is the maximum height above the floor that the ball reaches? How far above Christine’s hand is the ball when it reaches its maximum height? How is this value related to ∆y = yf − yi? Does the sign of ∆y make sense for this scenario? How do you know?
Create a particular model of this process and use it to answer the Big Questions. Use the CER framework, referencing any relevant diagram(s), to present your answer.
From Thinkabout 10.5: The initial upward speed of the ball in the phenomenon described above is 10 m/s, and the ball is released at a height of 1.5 m above the floor.
Big Question: With the same initial conditions as in Thinkabout 10.5, use the Energy-Interaction Model in two different ways to determine the speed of the ball when it is 4 meters above the floor, headed down:
- Construct a particular model of the entire physical process, with the initial time when the ball leaves Christine’s hand, and the final time when the ball is 4 meters above the floor, headed down.
- Divide the overall process into two physical processes by constructing two particular models and applying energy conservation for each:one diagram for the interval corre-sponding to the ball traveling from Christine’s hand to the maximum height; and one diagram corresponding to the interval for the ball traveling from the maximum height to 4 meters above the floor, headed down.
- Did you get different answers in parts (a) and (b) for the speed of the ball when it is 4 meters above the floor, headed down? Use the CER framework, referencing any relevant diagram(s), to present your answer.
Construct a particular model to show that an object thrown vertically upward will have the same speed as it comes down through any point that it had going up through that same point. Use the CER framework, referencing any relevant diagram(s), to present your answer.
One way to do this is to construct two Energy-Interaction Diagrams: One diagram should be from the point of release of the ball to some intermediate height as the ball is traveling upward, less than the maximum height; the second diagram should be from the point of release of the ball to that same intermediate height as the ball is on its way down. Then, compare the two diagrams.
From Thinkabout 10.5: The initial upward speed of the ball in the phenomenon described above is 10 m/s, and the ball is released at a height of 1.5 m above the floor.
In Activity ?? we assumed that y = 0 at the level of the floor. If, instead, we assume that y = 0 where Christine releases the ball – still 1.5 meters above the floor – will this change the maximum height above the floor attained by the ball? Construct a particular model to answer this question. Use the CER framework, referencing any relevant diagram(s), to present your answer.
Phenomenon: Christine drops a water balloon from the top of the Science Building. Let’s assume that the balloon does not break when it strikes the ground. There are many questions we could ask about this situation. To answer any of them, it makes sense to model the Energy dynamics of the scenario first. Let’s do that and then answer some particular questions!
- Create a particular model for this phenomenon for the process that takes place from the time the water balloon is dropped until it is motionless on the ground. Consider the indicators to determine what energy systems must be present/can be excluded. Have you included enough systems?
- If the water balloon falls a distance of 21 m, what is the maximum temperature rise of the water balloon due to its being dropped? (Does you answer seem reasonable? Why or why not? It may help to check your units.) Use the CER framework, referencing any relevant diagram(s), to present your answer.
- Is there anything that prohibits the water balloon from suddenly cooling off to its original temperature and leaping 21 m into the air? From the random nature of thermal energy, why do you think we never see this happen? Respond briefly.
Christine has a spring with a natural length of 20 cm and with spring constant k =
0.182 J/m2. Christine also has a 250 g mass. She adds the mass to the spring and carefully lowers the mass down 13.5 cm to its equilibrium position.
- Draw the spring and clearly label the natural length and equilibrium point.
- If the mass begins and ends at rest, does Christine do work on the spring? If so, how much? Create an Object Interaction and Energy Interaction Diagram to model this phenomenon.
- Suppose Christine then lifts the mass 7.1 cm above the equilibrium position. If the mass begins and ends at rest, does Christine do work on the spring? If so, how much? Create an Object Interaction and Energy Interaction Diagram to model this phe-nomenon.
- Christine now lets go of the mass (from 7.1 cm above equilibrium). Create a particular model for each of the following final conditions to predict the speed of the mass after it is released, and when it is:
- moving up through the equilibrium position,
- moving down through equilibrium, and
- 5.0 cm below the equilibrium position, moving down.
A 0.4 kg mass is attached to a spring that can compress as well as stretch (spring constant 50 J/m2). The mass and spring are resting on a horizontal tabletop. The mass is pulled, stretching the spring 48 cm. When it is released, the system begins to oscillate.
- Assuming the transfer of energy to thermal energy systems is negligible, construct a complete Energy-Interaction Diagram that could be used to predict the speed of the mass as it passes a point that is a distance of 39 cm from its equilibrium point on the other side of the equilibrium position (spring is compressed).
Substitute all known values of constants and variables into the algebraic expression of energy conservation, and identify any unknown(s). Do you have enough information to find the speed of the mass?
- Now assume that the effects of friction are not negligible. When pulled back and released as before, the mass now reaches its furthest distance from equilibrium at 40 cm on the compressed side (before bouncing back again). Construct a complete Energy-Interaction Diagram that could be used to determine the amount of energy transferred to thermal systems when going from the initial stretched position to where it first momentarily stops.
Proceed as in Part a: Substitute all known values and identify any unknown(s). Can you determine the increase in thermal energy?
A skier (of mass 55 kg) skies down the smooth (frictionless) ski slope illustrated in the cross-sectional diagram. She pushes off at the top with a speed of 10 m/s. At the bottom (0 m), she comes to a stop by digging her skis in sideways.
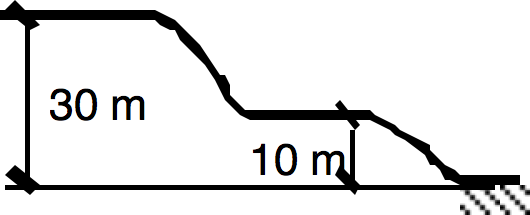
- Construct a complete Energy-Interaction Diagram that can be used to predict the speed of the skier when she is on the middle flat part (at 10 m). Substitute all known values of constants and variables, and identify any unknown(s). Do you have enough information to determine the speed at this part of the hill?
- Construct a complete Energy-Interaction Diagram that can be used to predict the skier’s maximum speed just before digging in her skis at the bottom. Substitute for constants and variables and identify any unknown(s) as in Part (a).
- Assuming that the snow at the point where she comes to a stop is at a temperature of 0 °C and that all of the kinetic energy of the skier goes into melting the snow, construct a complete Energy-Interaction Diagram that can be used to predict the amount of snow melted by the skier while stopping. Substitute for constants and variables and identify any unknown(s) as in Part (a).
Christine (from Activity ??) throws a 300 g ball straight up into the air. The ball is exactly 2 m above the ground when Christine lets go of it. It reaches a height 12 m above the height from which it was released, and then falls straight back down.
- Assume that y = 0 at the point of release of the ball. Find the maximum and minimum values of y and PEgravity.
What is the total energy of the system? Find the maximum and minimum values of
KE.
- Repeat Part (a), with y = 0 at the ground.
A 200 g mass is attached to a spring, just like in Activity ??. The mass is lifted up 5 cm and released so that it begins to oscillate about the equilibrium point. The spring has a spring constant k = 500 N/m (= 500 J/m2).
- Calculate and accurately plot on a letter size (8.5 × 11 in) sheet of graph paper PEelastic, Etotal, and KE. The vertical axis of the graph should be energy (in Joules). The horizontal axis is “distance from equilibrium” (in meters).
- On the same graph, quickly sketch (without calculating values) the PEelastic, KE and Etotal of the system if the mass were initially pulled back (stretched) 2.5 cm from its equilibrium point, instead of lifted up (compressed) 5 cm.
Remember the physical situation described in Thinkabout 12.2?
To refresh your memory:
A skier (of mass 55 kg) skies down the smooth (frictionless) ski slope illustrated in the cross-sectional diagram. She pushes off at the top with a speed of 10 m/s. At the bottom (0 m), she comes to a stop by digging her skis in sideways.
Use the algebraic expression of energy conservation that shows that the sum of all the energies at all points in time is constant and equal to the total energy for the following:
- Pick a location to set y = 0 and determine the total energy of the system.
- Write an algebraic representation expressing energy conservation that you could use to find the speed of the skier when she is on the middle flat part (at the height 10 m).
- Substitute all known values of constants and variables, and identify any unknown(s).
Three force vectors are added together. One has a magnitude of 9 N, the second one a magnitude of 18 N, and the third a magnitude of 15 N. What can we conclude about the magnitude of the net force vector? Explain.
- It must equal 42 N.
- It cannot be 0 N.
- Anything from -42 N to +42 N.
- It can be anything from 0 N to 42 N.
- None of the above can be concluded.
Alice, Bob and Chuck are three friends standing around, talking. We know that Alice is standing 9 m away from Bob, and that Bob is standing 3 m away from Chuck. Let ∆R⃗AB be the vector that starts at Alice and ends at Bob, and ∆R⃗BC be the vector that starts at Bob and ends at Chuck.
- Write an equation to find the displacement between Alice and Chuck.
- What is the furthest distance Chuck can be from Alice, given the information in the question? What is the closest they can be?
- Draw a picture where Chuck is neither as close as he can be or as far as he can be from Alice. Draw and label the vectors ∆R⃗AB and ∆R⃗BC.
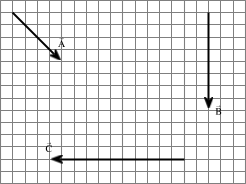
Using a piece of graph paper, carry out the operations listed below on the vectors shown at right. Label all vectors.
- A⃗ + B⃗
- B⃗ + A⃗
- A⃗ - B⃗
- A⃗ + B⃗ + C⃗
- B⃗ - A⃗
- -C⃗
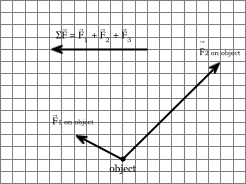
Vectors F⃗1 on object, F⃗2 on object, and F⃗3 on object are all exerted on an object, adding together to form a net force vector, ΣF⃗, as shown in the graph to the right. However, only vectors F⃗1 on object, F⃗2 on object, and ΣF⃗ are known.
On a separate piece of graph paper, use the properties of vector addition to graphically determine the vector F⃗3 on object.
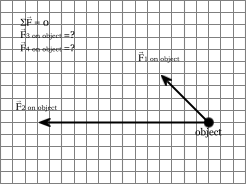
Vectors F⃗1 on object, F⃗2 on object, F⃗3 on object, and
F⃗4 on object are all exerted on an object, adding
together to form a net force vector ΣF⃗ = 0, as shown to the right.
However, only vectors F⃗1 on object, F⃗2 on object, and ΣF⃗ (which is zero) are known. It is
known that F⃗3 on object is completely vertical, and F⃗4 on object is completely horizontal.
On a separate piece of graph paper, use the properties of vector addition to determine
the magnitudes of the vertical vector F⃗3 on object, and the horizontal vector F⃗4 on object.
Two force vectors (F⃗1 and F⃗2, as shown to the right) act on a 2 kg object that has an initial velocity v⃗i of 3 m/s in the +x-direction.

- Use trigonometry to find the x- and y-components of the net force.
- Find the magnitude and direction of the net force.


x
Two rolling carts are moving toward each other at the same speed. Cart 1 has a mass
m1 = 200 g and Cart 2 has a mass m2 = 400 g.
- Draw a velocity vector v⃗ for each cart.
- Momentum p⃗ is a vector defined as p⃗ = mv⃗. Draw a momentum vector for each cart.
- Add the two momentum vectors together to find the total momentum, p⃗total = p⃗1 + p⃗2.
Rework the parts of Activity ?? that you still have questions about. Bring any remaining questions to the next discussion-lab meeting.
You’re playing with two of the carts (each with mass m) that you used in Activity ??. Initially, these two carts are moving toward each other with the same initial speed vi along the track. The carts collide and the result is one of these final states:
- Assume that the carts hit each other and stop so that the final state of the system has both carts just sitting still (not moving). Draw a Momentum Chart for this situation. Make a separate row for each cart.
- Assume that the carts bounce off each other so that the final state of the system has each cart moving opposite to its initial motion but with their speeds unchanged. Draw a Momentum Chart for this situation.
- As in (b), assume that the carts bounce off each other but now assume that the final speeds are smaller than the initial speeds, equal and in opposite directions. Draw a Momentum Chart .
- For each case above, does the total momentum of the system that contains the two carts change? How do the Momentum Charts help you answer this question?
- Is the total kinetic energy constant for all three cases? How do you know?
A rocket expels gas at a high speed out of its back for a short period of time. We are going to treat the rocket as being far away from any gravitational objects.
- Draw a Momentum Chart for the rocket expelling gas in space. Take the initial time before expelling gas and the final time after the rocket has finished expelling gas. The rocket has an initial constant speed in the horizontal direction. Put the rocket and the expelled gas on separate rows.
- Use your chart to explain why the rocket speed increases.
- Does the rocket have to keep expelling gas to stay at a constant speed? Explain.
Victoria is standing on a boat, during a perfectly calm day. Initially, both Victoria and the boat are not moving. Then Victoria walks from one end of the boat to the other. Take the initial time to be before she walks and the final time at some point while she is still walking.
- Draw a Momentum Chart for this situation. Does the boat move, and if so, in which direction?
- Compare the speed of the boat with Victoria’s speed. Are they the same or different? Why?
- What is the magnitude of the car’s initial momentum? (Use scientific notation)
- What is the magnitude of your initial momentum? Recall that the weight of one kilogram is 2.2 lbs.
- Draw separate Momentum Charts for the car and the person. Treat both as open systems with a net impulse.
- What is the magnitude of the change in the momentum of the car? (Use scientific notation)
- What is the magnitude of the change in your momentum?
- What is the net impulse that acts on the car to bring it to a stop?
- What is the net impulse that acts on you to bring you to a stop?
Consider how Momentum Charts can be used to understand the following two situations.
- You remain buckled into the seat and the seat remains attached to the center of the car.
- You are not buckled into your seat and you fly through the windshield and hit the wall.
- Is the magnitude of the impulse the same in both cases?
- Are the magnitudes of the forces acting on you the same?
- Using the words impulse, force, time, and momentum explain why one scenario is safer for you. Hint: Think about how the shape of the car changes when it hits the wall.
Thinkabout 18.7
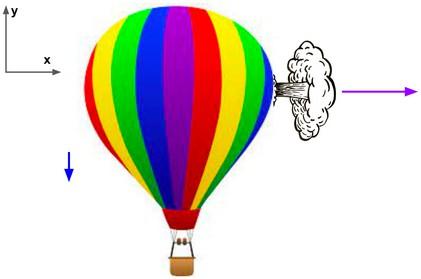
Instructions: Your task is to create a model in response to the prompts in the quiz below. Be sure to apply a model from this class and include the relevant diagram(s) for that model. Phenomenon: Hot Air Balloon
You are descending towards the ground in a hot air balloon with an initially constant velocity of 5 m/s downward. (Assume all vertical forces are balanced. This is because the lift from the balloon cancels the weight, but don’t worry about the vertical forces in this problem.) Suddenly a drone crashes into the side of the balloon. Hot air starts shooting sideways out of the hole in the balloon. The air leaving the balloon results in a force (air on balloon) with a magnitude of 300N to the left occurs over 10seconds. The total mass (of you, the balloon, and the basket you’re riding in) is 400 kg.
(You may not need to use all the information in the above paragraph to solve this problem. Assume the change in the balloon mass is negligible. )
Big Question: What is the resulting momentum of the balloon? Draw the vector and identify its magnitude and its components. You do not need to calculate any angles. Assume that there continues to be no net vertical force on the balloon, even after some hot air leaves. Use what you’ve learned in PHYS 2A so far to analyze this scenario and answer the Big Question. Reminder, you will be graded using the Quiz 3 Rubric. Be sure to include all representations and justifications relevant to the rubric.
Maybe useful information:
∆KEtranslational = 1 m∆v2 ∆PEgravitational = mg∆y ∆PEelastic = 1 k∆x2
2 2
p = mv L F∆t = ∆p I = L Favg∆t = ∆p
Note: This is an extension of Thinkabout 15.3. Two force vectors
(F⃗1 and F⃗2, as shown to the right) act on a 2 kg object that has an y
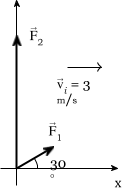
initial velocity v⃗i of 3 m/s in the +x-direction.
- Use the x- and y-components of the force you found in (a) to determine the x- and y-components of impulse that would act on the 2 kg object if the forces were applied for a time interval of 0.50 s. Always include units with your answers. Start with the relationship of impulse and force. Find each component of impulse separately.
- Find separately, for each component, the change in velocity of the 2 kg object, due to the impulse from (c).
- Find the magnitude of the velocity of the object after the im-pulse has acted and the direction the velocity vector makes with the positive x-axis.


Draw the path of the asteroid after the alien applies the force.
Along the path you chose in Thinkabout 19.9, how does the speed of the asteroid vary after receiving the “kick”? Is the velocity changing in direction? Is it increasing, decreasing or remaining the same in magnitude? Describe the motion.
Identify the forces acting on the asteroid, after the alien is finished applying the force.
When a rubber ball dropped from rest bounces off the floor, its direction of motion is reversed because
- energy of the ball is conserved;
- momentum of the ball is conserved;
- the floor exerts a force on the ball that stops its fall and then drives it upward;
- the floor is in the way and the ball has to keep moving;
- none of the above.
Two asteroids collide head-on and stick together. Before the collision, asteroid A (mass 1,000 kg) moved at 100 m/s, and asteroid B (mass 2,000 kg) moved at 80 m/s in the opposite direction. Use momentum conservation (make a complete Momentum Chart ) to find the velocity of the asteroids after the collision. Please give the mass and speed in Scientific Notation. This notation is used by scientists to help write numbers that are too cumbersome to write using decimals, and makes them easier to read and work with.
Two asteroids identical to those in Thinkabout 19.13 collide at right angles and stick together. “Collide at right angles” means that their initial velocities were perpendicular to
each other. You can assume that Asteroid A initially moved to the right and Asteroid B initially moved up.
Use the Momentum Conservation Model (make a complete Momentum Chart ) to find the velocity (magnitude and direction, expressed as the angle with the initial velocity vector of Asteroid A) of the asteroids after the collision.
Determine the decrease in total kinetic energy ∆KEtotal of the two asteroids in Think-about 0.53 and Thinkabout 19.14 when they collide. If the average specific heat of the material composing the asteroids is assumed to be that of ice (2.05 kJ/kg·°C), by how much does the temperature of the asteroids rise as a result of the collision in each case?
Turn to the Momentum Conservation Model summary page and do the following:
- Use the model relationships found there to analyze each physical situation, and
- Make logical arguments that would convince another physics student of your response to the following prompts.
Remember that a momentum conservation law requires you to compare a quantity at two times so you must always consider an initial time and a final time.
A heavy ball is attached to a string and swung in a circular path counter-clockwise in a horizontal plane as illustrated in the diagram to the right. At point P indicated in the diagram, the string suddenly breaks and the ball is released. If these events were observed from directly above, draw the path the ball takes immediately after the string breaks.

NOTE: Read through the textual materials on the Angular Momentum Model. Work hard on seeing the analogies between linear momentum phenomena and angular momentum phenomena.
“Torque” can be best described as which of the following? Give an example of both a force and a torque and explain why in a couple of sentences.
I. Rotational force. II. Rotational velocity. III. Rotational energy. IV. Rotational power.
V. All of the above.
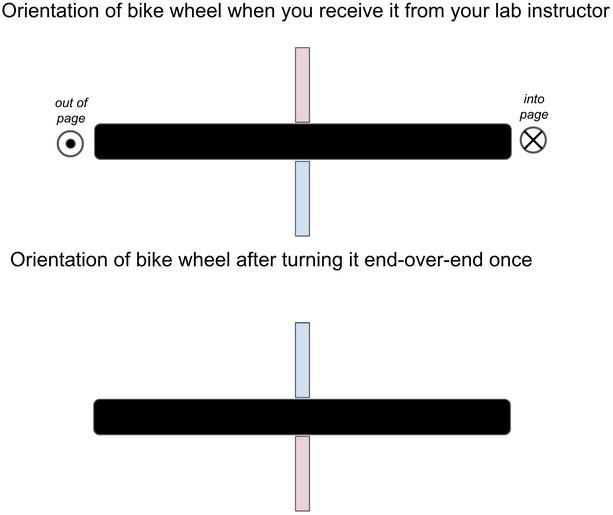
Phenomenon: Flip a spinning bike wheel while sitting on a stool free to rotate
You are sitting on a stool that has a seat with the ability to rotate very easily. Your lab instructor hands you a bike wheel that is spinning at a constant angular velocity. The bike wheel is oriented as shown in the image above when you receive it from your lab instructor. Then, you quickly turn the wheel end-over-end once.
Big Question: What do you think will happen?
- Draw a physical scenario diagram for before you flip the wheel and then immediately after you flip it. Identify the direction the wheel is rotation. Label Li, Lf , ∆L, τ

- Make an angular momentum chart with two interacting objects. One object will be ”you + stool” and the other object will be the bike wheel
- Is the torque you exert on the bike wheel an external or internal torque?
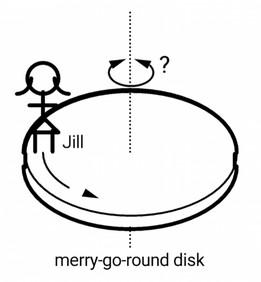
Phenomenon:Jill is atop a stationary merry-go-round, which is shaped like a disk and is free to spin around a vertical, frictionless axis. Jill is herself initially stationary.
Big Question: If Jill begins to walk in the counterclockwise direction on the surface of the merry-go-round, what will the merry-go-round do?
- Use an appropriate diagram (energy-interaction, momentum, or angular momentum) to explain what will happen
- Create a vector equation and use column vectors to develop an algebraic expression that expresses your answer
- Use what you know about rotational inertia and predict the relative angular speeds of Jill and the merry-go-round (come up with an expression relating the two). Which one will rotate faster? Why?
- Finally, how is “Jill on the merry-go-round” like “Victoria on the boat”?
Circle all of the forces shown acting on a disk of radius r (shown above) which exert a non-zero torque about point ϑ. Cross out all forces which exert a zero torque about point ϑ. (This is a top view of the disk, as seen from above.) If you are having trouble, draw these on a piece of paper and holding it at the pivot point, actually apply the force by pulling and see what happens. For each of forces that exert a non-zero torque, make a drawing showing the moment-arm, r, the force, F, and the tangential component of the force, Ftangential
For each of the forces in (the disk to the right) that exerts a non-zero torque about point ϑ, use the right-hand-rule to state whether the torque points out of the plane of the drawing or into the plane of the drawing.
Now we pin the disk in place at the pivot point so that the disk can rotate freely about the pin. Suppose there are only 3 forces, F⃗3, F⃗5, and whatever force the pin exerts, on the disc (i.e. no force of gravity in this problem). Could both the torques and the forces be balanced in this problem? Explain. Include in your explanation drawings of the appropriate force diagram and extended force diagram
A physical therapy patient contracts her biceps muscle, and exerts a horizontal force of 180 N on the spring shown in the figure below. Assume the forearm rotates at the elbow.
- Draw an extended force diagram of the forearm (everything from the elbow to the tip of the fingers) showing the pivot point and all of the forces acting on the forearm where they actually are applied. You won’t know the magnitudes (or even the directions) of these forces until you finish the whole problem but just draw reasonable vectors for now.
- Now draw a force diagram with the forearm as a dot.
- Use the fact that the forearm is perfectly stationary at all times (it is “static”) to find the horizontal force that her biceps exerts on her forearm AND the force exerted by the bone of the upper arm (shown below the biceps) on the forearm (weight = 30N). Note that muscles can only PULL in the direction along the muscle, but that ligaments (like the ones in the elbow that connect the upper arm with the forearm) can exert forces in any direction.
- Explain in complete English sentences (i.e., not just equations) why the bone of the upper arm exerts such a large force on the forearm.
- What is the advantage of having the point where the biceps is attached to the forearm so close to the elbow? What is the disadvantage of having it attached so close?
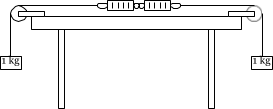
A puzzle to think about: Two weights of mass 1 kg hang from strings which go over pulleys (see illustration below). The strings are attached to the two ends of a spring scale which reads the force. Does the scale read 0 N, 9.8 N, or 19.6 N? Why?
Spring Scale
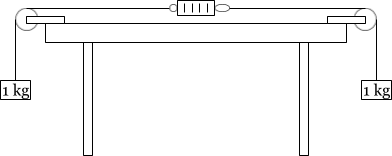
Hint: Draw a Force Diagram for the scale in this situation and then draw a Force Diagram
for the scale when it is being used to weigh a hanging object with mass 1 kg.
Your little brother is playing with monkeys in a barrel. The mass of each monkey is indicated in the illustration on the right. Note that your brother is holding the monkeys still and his hand weighs 50 N.
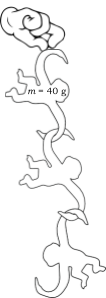
- Make a separate Force Diagram for each of the four objects, the hand, top monkey, middle monkey, bottom monkey.
- Identify all 3rd law pairs of forces appearing in your Force Di-agrams by circling the two forces and connecting them with a line.
- Use Newton’s 1st and 3rd laws to numerically determine all of the forces acting on the monkeys and the hand. If necessary, redraw your Force Diagrams, so they are more to scale.


We’ve already investigated this problem with one spring scale in Thinkabout 25.1. Now, imagine you have two spring scales, A and B, connected at the end of the scale that doesn’t move. The end that moves of each spring scale (where you take readings from) is attached to a string that goes over a pulley and connects to a 1 kg mass for both spring scales A and B.
Spring Scale A
Spring Scale B
- State what you think each spring scale will read in this situation.
- Construct a logical argument that explains why the spring scales read what you reported in Question (a). You should treat this as a quiz/test question and therefore use complete sentences, reference any models you think will strengthen your argument, and provide evidence to support your claim.
State whether the acceleration is positive, negative, or zero for each of the position functions x⃗(t) in the position versus time graphs below. How do you know?
(a)
(b)
(c)
(d)

t t t t




For each of the following scenarios make a position vs. time graph. Directly below it, draw a velocity vs. time graph, and underneath that draw acceleration vs. time.
- A dropped object while it is falling (before it hits the floor).
- A rocket firing its engines for a certain length of time descending on Mars.
- A race car during the first 10 seconds after it starts from a stop.
Underneath the appropriate column of graphs from Thinkabout 38.2, write an equation that solves for the variable in question (see below). Write which model you used: Newtonian Force Model, Energy-Interaction Model, the Momentum Conservation Model, etc... If you introduce any new variables, clearly indicate what they mean.
- The velocity of a dropped object just before it hits the floor.
- The time it takes the dropped object in (a) to reach the floor after being dropped.
- The change in velocity for a spacecraft firing its rockets for a certain length of time.
- The speed of the race car after the first 10 seconds.
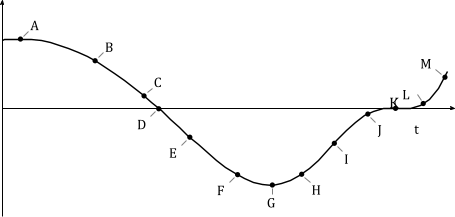
Interpret the graph below as representing the velocity of an object versus time. Rank the points in order of increasing acceleration (from most negative to most positive). Practice walking this plotted motion.
v
0
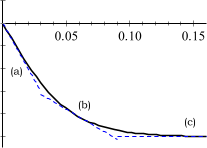
Shown below is the velocity graph of a coffee filter (mass 1 gramm) that has been released from rest. Note the break in the time axis. Four distinct intervals are shown on the graph:
- Speed downward increasing from rest, 0 s ≤ t ≤ 0.03 s.
- Speed downward increasing, 0.03 s ≤ t ≤ 0.09 s.
- Speed downward is constant, 0.09 s ≤ t ≤ 4.99 s.
- Landing on the floor, 4.99 s ≤ t ≤ 5.00 s.
0.1
0
−0.1
−0.2

−0.3
−0.4
−0.5
t [sec]
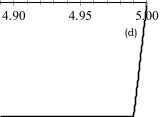
Draw an acceleration graph for the same time intervals above. You may use the tangent lines drawn on the velocity graph to calculate the average slopes of the velocity curve during the first two intervals.
Refer to the graphs below. Data for these graphs was collected using a motion detector mounted above a basketball that was dropped from a height of 1.5 m above the floor. The position measured and indicated is the position of the top surface of the ball. The veloc-ity graph was computed by the software as the derivative of the position vs. time graph. Complete the following tasks related to this situation.
- Determine accurately the acceleration from the velocity graph and plot it on the accel-eration axis. Make sure you extend the acceleration curve as far as the other two are
extended in time.
- Describe the motion of the ball at the six indicated times numbered 1 to 6. That is, describe where it is located and say something about its speed, direction of motion, and acceleration. If you look closely, you should see that at position 3 the ball is still in contact with the floor.
- Draw Force Diagrams for each of the six marked times. For which times are the Force Diagrams identical?
- For the times when the Force Diagrams are identical, which aspects of the mo-tion are identical? Which aspects are different? Are your answers to the previous two questions consistent with Newton’s 2nd law?
- Determine the average value of the force exerted by the floor on the ball between the times numbered 2 and 3 two differ-ent ways:
- from the impulse imparted to the ball from the floor and the velocity graph; and
- using Newton’s 2nd law.
1.5
1

0.5
0
10

0
−10
100

0
1
6
t [sec]
t [sec]
t [sec]
Explain in two ways (one for each approach) why the force of the floor on the basketball [while it bounces] is so much greater than the basketball’s weight.
Consider the following problem that many beginning physicists struggle with:
“How is it that at a certain instant in time, an object can have zero velocity, but at that same instant, have a non-zero acceleration?”
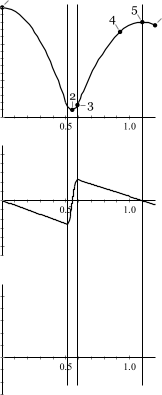
Figure out how to explain this using the graphs of the motion of the dropped and bouncing basketball, the basic definitions of velocity and acceleration, and Newton’s 2nd law.
Thinkabout 39.5
Cart and Horse Paradox: If a horse pulls on a cart, and the cart pulls back on the horse with an equal magnitude force, how can either possibly begin to move?
Use what you have learned about force to give a complete explanation of this paradox. For a complete explanation, construct and refer to complete Force Diagrams for each of the following:
- the horse,
- the cart, and
- the whole system (horse & cart).
Consider the following situations:
- An object starts at rest and then speeds up at a constant rate moving to the right
- An object starts at rest and then speeds up at a constant rate moving to the left.
- An object starts with a velocity to the right and then speeds up at a constant rate.
- An object starts with a velocity to the right and then slows down at a constant rate until it stops.
- An object starts with a velocity to the right and then has a negative acceleration. f ) An object is stationary.
- An object has a constant negative velocity.
- An object has a constant positive velocity. For each situation do the following:
- Create a graph of velocity vs time
- State what your slope says about the motion
- State what the area under the curve tells you about the motion
- Create an equation for the area under your curve (might just be a line) in terms of the initial velocity, the change in velocity, and the change in time
Consider the following situations: Compare a situation where Christine flicks a pen off of her desk at the same time as she drop another one. Which pen will hit the ground first?Once you and your group agree on a result, test it out around your desk (or table).Based off of your results, what causes the pen to accelerate in the vertical direction? Also, what causes the pen to accelerate in the horizontal direction?